US Car Accident Data in 2020; How Much Did Covid-19 Play a Role?
Accident Counts Are Down, But Fatalities Steadily On The Rise
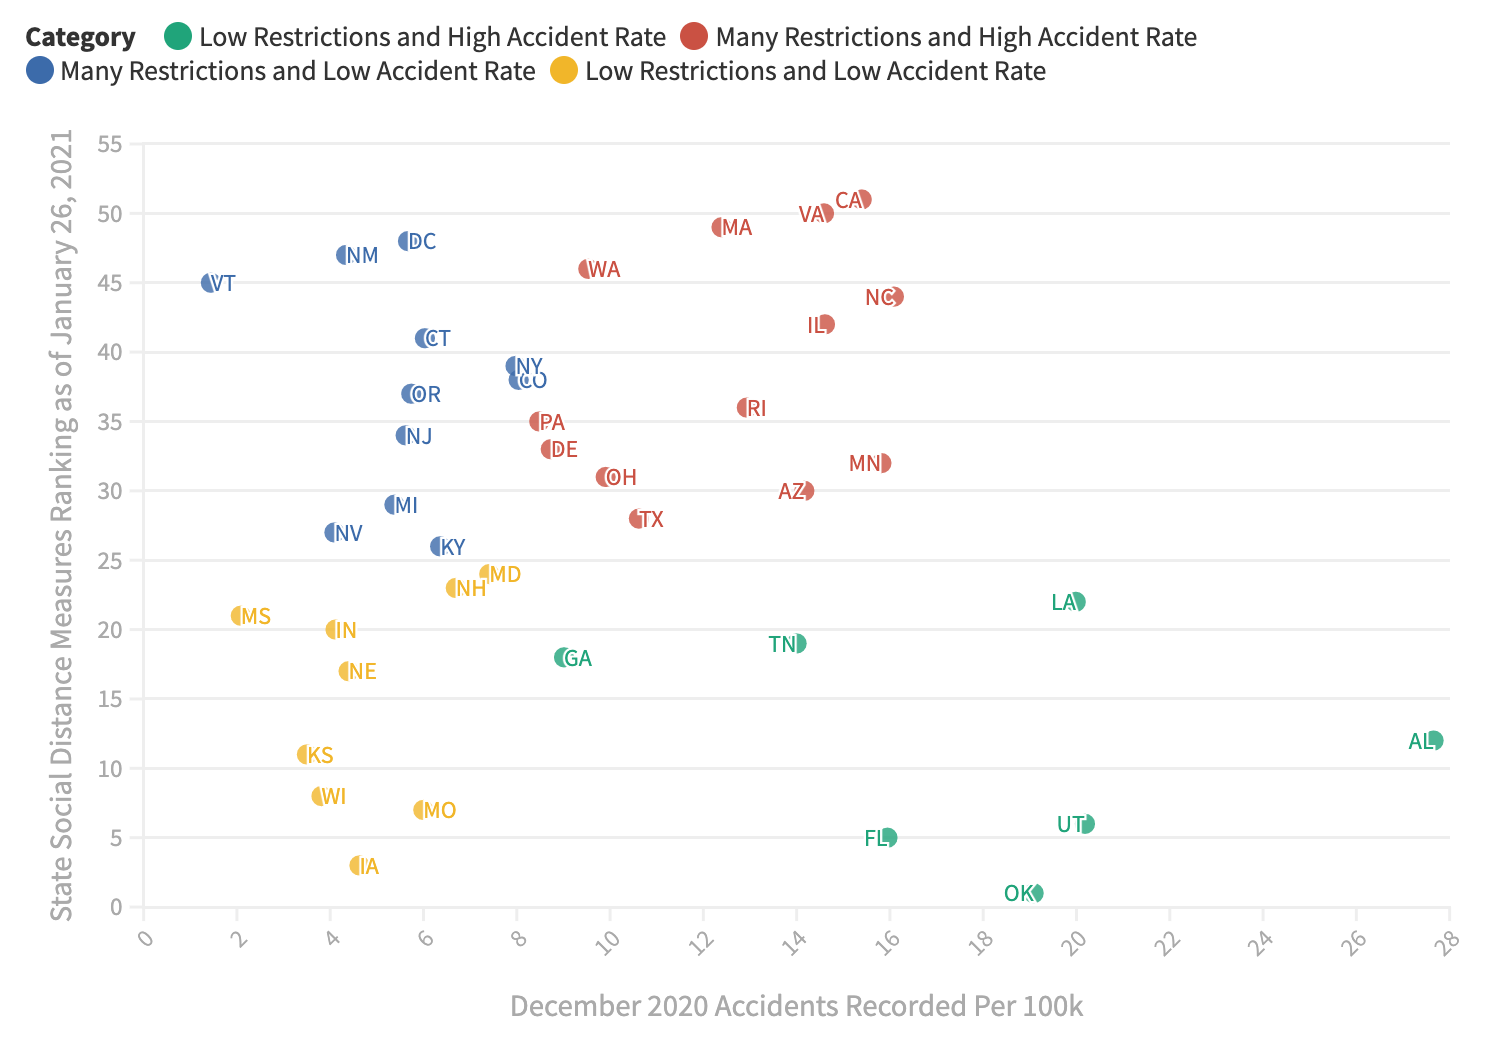
The Covid-19 pandemic had a significant impact on our nation’s driving patterns. The closing of schools, most work offices, and non-essential businesses lead to a dramatic decrease in VMT (Vehicle Miles Travelled) across the nation. However, states differed heavily on restrictions, closings and safety precautions, especially later in 2020 after the pandemic had already been occurring for quite some time. For example, in December of 2020 Rhode Island was ranked 36 in the level of social distancing measures within each state (1 being the least restrictive), while the State of Iowa was ranked far higher at 3. And yet, Rhode Island is down 26.34% in total car accidents, while Iowa hovers around a similar number, down 25.13%. A chart of most states can be seen here…
Five of the top six states in US accidents per 100k were categorized as having low restrictions with states like Louisiana at 19.98 accidents per 100k and Oklahoma at 19.08 accidents per 100k. However, the state of California which ranked 51 in social distancing measures was not far below at 15.39 accidents per 100k. Other states ranking similarly to California such as Virginia and North Carolina also had similar results in car accidents and were among the top 10 states found in the dataset to record vehicle accidents per 100k. Sobhan Moosavi, a data analyst for Lyft who compiled the data notes, “initially, we have seen a decreasing trend when pandemic had just started, and then gradually we have observed traffic is going back to normal, so the # of accidents started to increase”.
Sobhan and other analysts often speak of time progression as a key point of analysis, comparing data overtime, or looking at how data matched with previous data in the same calendar year. For example, Florida recorded 3,072 car accidents in June of 2020, but had an increase to 3,425 in December of 2020. However, one can find interesting results when comparing all of the data of state car accident records from December 2019, to December 2020. It was the same time in the calendar year, but two very different societies, with one being free of the pandemic.
While there are some outliers in the recorded data, states show a steady decrease in car accidents recorded, with an average decline of 33.18%, meaning that there was a drop of nearly a third of all recorded car accidents. States like Utah decreased from 23.18 accidents per 100k to 20.18, while Arizona dropped from 20.72 to 14.16. Interestingly, the state of Massachusetts saw a 2.15% increase in accidents in December 2020. Officer Kathy Mcgraph of the Framingham Police Department responded to this statistic saying, “there’s been less, but I just don’t think much has changed, people still need to get groceries, go out”. Nevertheless, Massachusetts is an outlier in a list of states that show significant decrease in US car crashes. While these significant drops in car crashes are telling signs of road behavior, they do not speak for the severity of certain crashes and speak to the amount of fatalities suffered in these accidents.
A surprising report released by the NHTSA revealed that the total count of car fatalities were in fact not down this year but have remained generally the same when compared to numbers in 2019 and in some cases, they have even increased.
The data shows that in fact there has been a general increase in car fatalities with an average of 138.78 more fatalities per month in 2020 compared to 2019 through September. That’s an overall increase of 4.6%. How could this be possible with the lower recording of crashes and VMT in 2020 compared with 2019? Jeff Larason, a highway safety data analyst of the NHTSA based in Cambridge Massachusetts, points out the number of fatalities, emphasizing that they generally remained the same: “there was a precipitous decline in the vehicle miles traveled (VMT). The result is that the fatality rate (VMT/fatalities) will have increased significantly in 2020”. It is important to note that these conclusions are based on preliminary data and that MassDOT is still in the process of determining the precise values for VMT.
Nevertheless, the findings are astounding as it seems very unlikely that fatalities could have stayed the same with such a significant decrease in people on the roads. Even more odd is the fact these trends occurred in states, like Massachusetts, that were especially known to have heavy restrictions and social distancing measures. One theory Larason proposes to answer the data is that “the people who were ignoring those (Covid) restrictions were the same people who drive dangerously.” The NHTSA is an organization that firmly believes in the idea that nearly all US car crashes are attributed to negligent or criminal behavior, going as far as to omit the term “accident” and instead using the terms “crash” or “collision” in their published data and analysis. This perspective leads one to find that people involved in car crashes are those demonstrating unsafe behavior. Therefore, if safe people stayed home and obeyed the federal guidelines, while unsafe people ignored the guidelines and continued to drive unsafely on the roads. Then the numbers would not have been likely to change because people involved in car crashes are likely to demonstrate unsafe behavior in general. Perhaps the lack of backed up roads from heavy traffic allowed unsafe drivers to speed more often, resulting in more serious incidences of car crashes. Regardless, if the preliminary data proves true, Massachusetts and most other states will have seen one of, if not, the largest annual increase in fatality rate for the year of 2020.