Stanley Cup parties and avoiding their hangovers
For the Washington Capitals’ 44-year existence, the team had failed to win the Stanley Cup, hockey’s most coveted trophy. They had only advanced to the finals once and lost in a clean sweep of the series. This franchise knew heartbreak, and fans were tired of cheering for a team that always let them down.
“It almost makes you want to stop cheering for them,” said Emily Minton, a Northern Virginia native and longtime season ticket holder.
All those years of heartbreak washed away on June 7, 2018, when the game clock struck zero in Game 5 of the Stanley Cup finals and the Washington Capitals beat the Vegas Golden Knights. The Caps were crowned the champions for the first time in history.
“I felt like a huge weight had been lifted off my shoulders. It was like a relief that all my time spent watching them and cheering hadn’t been for nothing,” said Minton.
Now, the 2018-2019 season is underway after a summer frequently documented drunken celebrations, and many fans dread the Stanley Cup hangover. A Stanley Cup hangover is when, after winning the championship the previous season, a team has a noticeably worse season the following year.
“It’s such a hard thing,” Ken Hitchcock, Stanley Cup winning coach of the 1999 Dallas Stars, says to Sports Illustrated about avoiding the dreaded Cup hangover. “To ask players to repay the high price they paid is not as simple as the words say. You’re asking the players to do things that aren’t really very natural. You’ve really got to find a way for them to get re-engaged.”
Winning the Stanley Cup is challenging, but avoiding a Stanley Cup hangover is even more so.
What is a Stanley Cup hangover?
When attempting to determine whether or not the Stanley Cup hangover is real, a concrete definition of a hangover is necessary. A team that suffers from the Stanley Cup hangover will experience a decrease in performance, particularly among specific key stats. If a team meets seven of the following regressions, we will consider them to have had a hangover.
For determinants 5-15, the percentages which a hungover team drop below are the league medians over the years analyzed.
A major decrease in team points is the most obvious sign of a hangover for a championship team. Though repeating as champions is extremely difficult, regular season success is expected to be similar to the previous year, the season when the Stanley Cup was won. The rest of the statistics measure a team’s success on the ice beyond wins and losses. The advanced metrics such as Corsi For Percentage and Scoring Chance Goals For Percentage measure a team’s efficiency on the ice and give a more in-depth look at how successful they are.
A team that repeats as champions are automatically removed from consideration of having a hangover, as they were able to repeat the most difficult level of success.
And lastly, a team that does not meet seven of the above qualifications may still be considered to have a hangover if their regression in some of the categories was drastic enough to pull them down in other categories. Likewise, if a team meets seven or more of the qualifications but the regression is minimal, discretion will be taken when determining the validity of their hangover. These 15 qualifications serve as the guidelines for considering whether or not a team suffers from a hangover.
The 2012 Kings championship and the 2013 Blackhawks championship are excluded from this narrative because the 2012-2013 NHL lockout, which lasted from Sept. 15, 2012 – Jan. 6, 2013. The shorter season provides incomplete data and therefore conclusions cannot be reliably drawn.
Looking at teams who have won over the past ten years, four were hungover and four escaped the hangover.
Escaping the hangover
In order to draw conclusions regarding the possible Capitals hangover, past champions and their subsequent seasons must be considered. Of the last 10 years, four teams’ production remains consistent the year after a Stanley Cup victory. Specifically, the 2009-2010 Pittsburgh Penguins, 2011-2012 Boston Bruins, 2015-2016 Chicago Blackhawks, and 2016-2017 Pittsburgh Penguins all experienced similar or greater success the year after winning the Stanley Cup.
While the recurring presence of the Pittsburgh Penguins suggests a unique franchise stability, the high number of other teams who maintain their success suggests that the inevitability of a Stanley Cup Hangover is a myth. While teams certainly can suffer from a hangover, the success of many defending champions suggests that the Stanley Cup hangover is avoidable.
As in the case of the 2011-2012 Boston Bruins, the season after a championship can be a time for improvement. The Bruins experienced major boosts in all categories except for points (decrease of one percent), Scoring Chance Saves (decrease of two percent), and High Danger Saves (decrease of one percent), meaning they only fell short in one category.
The Bruins did not play defense as well as during their championship season, as evidenced by save percentages decreasing. What they lacked in goalkeeping they certainly made up for in shooting, as they scored an extra 16 goals thanks to increases in all of the advanced offensive metrics.
The 2016-2017 Pittsburgh Penguins repeated as Stanley Cup Champions, proving they clearly did not suffer from a hangover, though a more in-depth look at the differences between championship teams makes it clear that the Penguins maintained excellence. They finished the regular season behind only the Washington Capitals with an incredible 111 points. Additionally, despite shooting less than 50 percent of the shots in a game, more than 50 percent of scoring chances resulted in goals. This means that the 2016-2017 Penguins were extremely efficient, generating only the best of scoring chances.
Falling victim to the hangover
While some teams are able to avoid the dreaded hangover, others are not as lucky. The four teams which experienced what we classify as a Stanley Cup Hangover are the 2008-2009 Detroit Red Wings, the 2010-2011 Chicago Blackhawks, the 2014-2015 Los Angeles Kings, and the 2017-2018 Pittsburgh Penguins.
The 2008-2009 Detroit Red Wings were a team close to escaping a hangover with decreases in seven categories, which dropped just enough for us to notice. The 2014-2015 Los Angeles Kings did not significantly drop in more than three categories but failed to qualify for the Stanley Cup playoffs and were comparatively much worse than many other teams that season.
The 2010-2011 Chicago Blackhawks offer a look at the average hangover, a team who hit the seven minimum decreases in production to qualify as hungover. Most notably, there was a significant decrease in team points after the Hawks won the Cup. Because they lost 8 more games than the previous season with one extra overtime win, they ended the 2010-2011 season with 15 less points than the year prior. A major contributor to this poor record is their Goals For and Goals Against. After winning the Cup, they scored 10 less goals but allowed 17 more than the year before. Both of these factors strongly indicate a hangover.
In addition to the goals and team points, the team saw significant decreases in Corsi For, Scoring Chance For, High Danger Chance For, and High Danger Goals For, meaning their efficiency at generating and capitalizing on scoring opportunities fell. While their power play percentage increased, their penalty kill percentage decreased to a greater extent, eliminating special teams’ progress. In fact, the power play production is the only statistics to significantly improve the season after the Blackhawks won the Cup. In fact, none of their statistics increased by more than one percent, and all of the others decreased by no more than two percent. By themselves, it is insignificant, but combined, it shows a lack of consistency and progress following their championship.
On avoiding hangovers and replicating success of the past season, Peter Hassett, co-founder of the Washington Capitals fan blog, Russian Machine Never Breaks, stressed how difficult this can be: “The NHL has enough parity and randomness to make back-to-backs very hard to accomplish. One would have to be very, very lucky to do so – and then the hangover will come hard.”
And boy, did the hangover come hard for the 2017-2018 Pittsburgh Penguins, a team coming off back-to-back championship seasons who subsequently fell far back in the standings. This team had the highest number of statistical regressions of any team we analyzed.
Following a 111-point performance in the 2016-2017 season, the Penguins dropped 11 points to finish with 100. Their high danger chances compared to their opponents decreased by two percent and their ability to convert shots into goals suffered all around, but especially with high danger opportunities.
The 2017-2018 Penguins had several large regressions as well. Their percentage of goals scored off of all chances in a game dropped by 11 percent and their percentage of goals off high danger opportunities in a game dropped by 10 percent, with both numbers dropping below 50 percent. This means that of all scoring opportunities in a game, the Penguins are converting on less than half of them.
Lastly, the Penguins Scoring Chance Save percentage and High Danger Save percentage experienced slight regressions of two percent, just enough to take note of, though this is not surprising as the Penguins lost their starting goaltender in the Las Vegas expansion draft.
The Washington Capitals
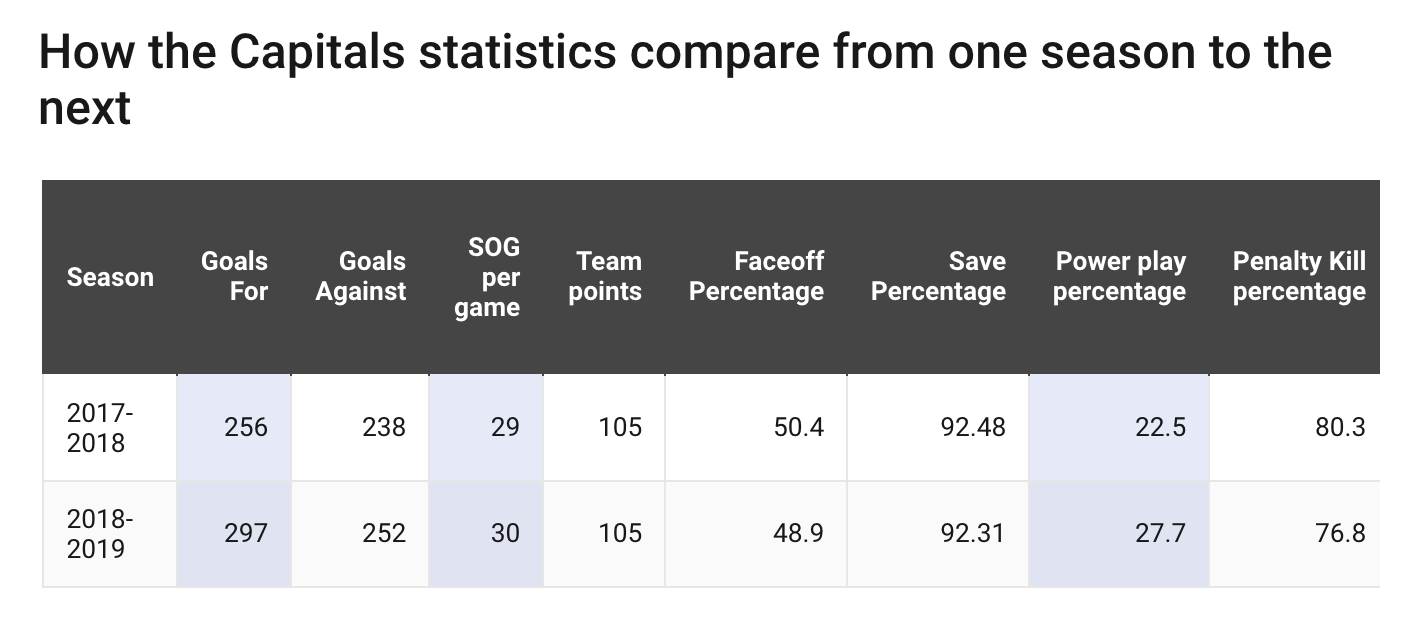
How have the Washington Capitals fared so far this season? Surprisingly well.
“The Capitals currently are atop the Metro Division, which represents success,” said Hassett. “They have the highest shooting percentage in the league during 5-on-5 play, which suggests that at least one of those elusive “lucky” factors are still in their favor.”
So far in this season, there might be more than one lucky factor in their favor. The only statistic that has decreased enough to note is their High Danger Chances For, which went down by two percent. In fact, despite their chances being down, their High Danger Shots and High Danger Goals For are both significantly up, by five percent and three percent. This means that despite having fewer high danger opportunities than their opponents, their ability to convert the chances they do get into shots and goals has increased since last season, with their high danger shot chances ranked second in the league.
In fact, for the last two seasons, the Caps have been scoring more than expected and allowing less goals than expected.
Of the teams we examined, few have maintained or improved their numbers to the extent the Capitals have from one season to the next. This is also impressive for another reason: the offseason and injuries. During the summer, the Capitals traded back-up goaltender Philipp Grubauer to start for the Colorado Avalanche and faceoff specialist Jay Beagle signed a new contract with the Vancouver Canucks.
While the Capitals faceoff percentage has slightly suffered from this season to the last, new backup goaltender Pheonix Copley has been playing admirably, maintaining above average save percentages while starting goaltender Braden Holtby was out for several games with an upper body injury.
Other key members of the Caps line-up have been injured as well, such as Brooks Orpik, a veteran defenseman who is missing a minimum of seven weeks following knee surgery, and T.J. Oshie and Evgeny Kuznetsov, two top 6 forwards who both suffered concussions in the Nov. 14 game against the Winnipeg Jets.
Then there’s Tom Wilson, who missed the first 16 games of the season due to a suspension for an illegal hit during the preseason, and then suffered a concussion 11 games later. Wilson is on track to have a career season with 14 points since returning to the lineup. Center Nicklas Backstrom, who is 31 years old, is also on track to have a career season, with 34 points in 29 games. Lastly, Captain Alex Ovechkin is on track to score at least 60 goals this season, a feat that is virtually unheard of for players older than 30.
“Most importantly, the team is winning games. Whether they’ll be able to repeat as champions is another matter, but that should not be the threshold for a hangover,” said Hassett.
All of this analysis considered, it is easily concluded that the Washington Capitals are not having a Stanley Cup hangover.
Numbers thanks to Hockey Reference, Natural Stat Trick, and Corsica Hockey.
Glossary: Goals For (GF) - Count of Goals for that team
Goals Against (GA) - Count of Goals against that team
Shots on Goal/60 (SOG/60) - Rate of Shots for that team per 60 minutes of play
Record - the number of games won, regulation lost, and overtime lost
Points - Two points are awarded for a win, 1 point is awarded for an overtime loss, and no points are awarded for regulation loss
Faceoffs Won Percentage (FOW%) - The percentage of faceoffs won by that team
Save Percentage (SV%) - Percentage of shots against that team that were not goals
Power play Percentage (PP%) - Percentage of times a team successfully scores on a man advantage penalty
Penalty Kill Percentage (PK%) - Percentage of times a team a is able to prevent a team from scoring on a man advantage penalty
Corsi For Percentage (CF%) - Percentage of total shot attempts in games that team played that are for that team
Scoring Chances For Percentage (SCF%) - Percentage of total Scoring Chances in games that team played that are for that team
High Danger Chances For Percentage (HDCF%) - Percentage of total High Danger Scoring Chances in games that team played that are for that team
Scoring Chance Goals For Percentage (SCGF%) - Percentage of total goals off of scoring chances in games that team played that are for that team
Scoring Chance Shot Percentage (SCSH%) - Percentage of Scoring Chance Shots for that team that were goals
High Danger Goals For Percentage (HDGF%) - Percentage of total goals off of High Danger Scoring Chances in games that team played that are for that team
High Danger Shot Percentage (HDSH%) - Percentage of High Danger Shots for that team that were goals
Scoring Chance Save Percentage (SCSV%) - Percentage of Scoring Chance Shots against that team that were not goals
High Danger Save Percentage (HDSV%) - Percentage of High Danger Shots against that team that were not goals